Decoding Azure Monitor: Mastering Log Categories and Category Groups with the Azure Portal’s JSON Export Tool
When working with Azure Monitor to configure diagnostic settings, one of the challenges is understanding the log categories and category groups for a specific Azure service. Each service exposes its telemetry through these categories, which can be configured to stream logs and metrics to destinations such as Log Analytics, Event Hubs, or Storage Accounts. Log categories represent individual streams of telemetry, while category groups are higher-level aggregations that bundle multiple related log categories together. Every log category ultimately rolls up into one or more category groups, making it essential to understand both constructs to configure diagnostic settings effectively.
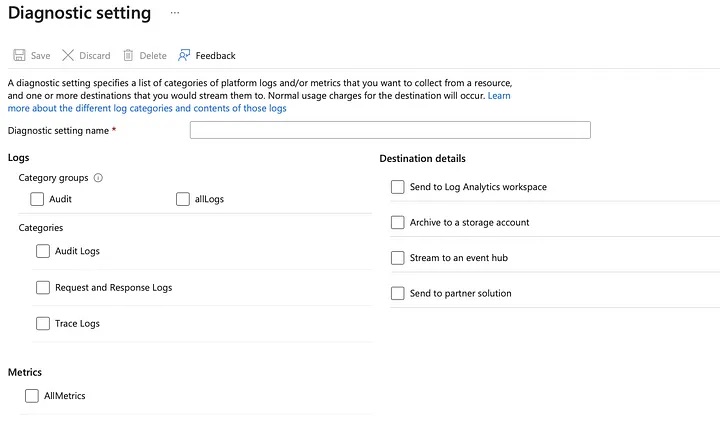
Azure services have their own unique sets of log categories and category groups. For instance, while most services provide a standard “AllMetrics” category to represent Azure Monitor metrics, some services, such as Azure Key Vault, offer additional, specific metric categories. Identifying these categories and groups can be tricky, especially when working with new or unfamiliar services. Fortunately, the Azure portal provides a useful feature that simplifies this discovery process by exporting the configuration for Azure Monitor diagnostic settings as an ARM template in JSON format.
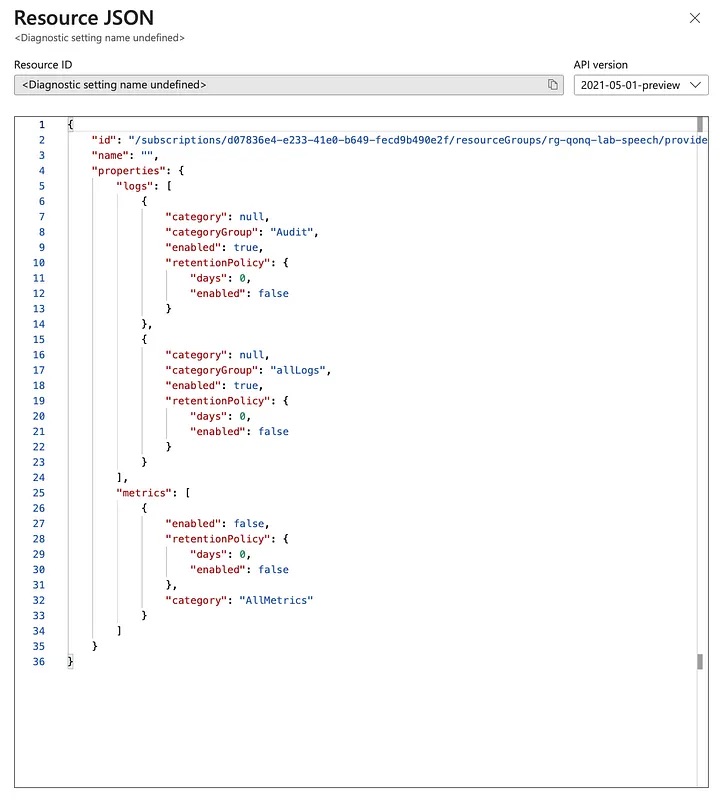
By navigating to the diagnostic settings page of a resource in the Azure portal, you can configure and export the settings. The exported JSON includes detailed information about the available log categories and category groups. For example, for Azure Key Vault, the JSON might reveal individual log categories like “AuditEvent” and “AzurePolicyEvaluationDetails.” These are the granular streams of telemetry data available for collection. Additionally, you might see category groups such as “audit” and “allLogs,” which roll up multiple log categories into broader groups for easier management.
{
    "id": "/subscriptions/72ad441d-0ca9-4cba-a820-d62a9794e49b/resourceGroups/rg-devops-dev/providers/Microsoft.KeyVault/vaults/kv-devops-dev-grffye/providers/microsoft.insights/diagnosticSettings/",
    "name": "",
    "properties": {
        "logs": [
            {
                "category": "AuditEvent",
                "categoryGroup": null,
                "enabled": true,
                "retentionPolicy": {
                    "days": 0,
                    "enabled": false
                }
            },
            {
                "category": "AzurePolicyEvaluationDetails",
                "categoryGroup": null,
                "enabled": true,
                "retentionPolicy": {
                    "days": 0,
                    "enabled": false
                }
            }
        ],
        "metrics": [
            {
                "enabled": true,
                "retentionPolicy": {
                    "days": 0,
                    "enabled": false
                },
                "category": "AllMetrics"
            }
        ]
    }
}
Understanding the distinction between categories and category groups is pretty simple. Log categories provide fine-grained control over the telemetry you collect. If you only need specific data, such as policy evaluation logs, you can enable just the “AzurePolicyEvaluationDetails” category. On the other hand, category groups are designed for convenience. Enabling a group like “allLogs” ensures you capture all related telemetry without needing to configure each category individually. This is particularly helpful when you want comprehensive monitoring coverage but don’t have the time to explore each category in detail.
{
    "id": "/subscriptions/72ad441d-0ca9-4cba-a820-d62a9794e49b/resourceGroups/rg-devops-dev/providers/Microsoft.KeyVault/vaults/kv-devops-dev-grffye/providers/microsoft.insights/diagnosticSettings/",
    "name": "",
    "properties": {
        "logs": [
            {
                "category": null,
                "categoryGroup": "audit",
                "enabled": true,
                "retentionPolicy": {
                    "days": 0,
                    "enabled": false
                }
            },
            {
                "category": null,
                "categoryGroup": "allLogs",
                "enabled": true,
                "retentionPolicy": {
                    "days": 0,
                    "enabled": false
                }
            }
        ],
        "metrics": [
            {
                "enabled": true,
                "retentionPolicy": {
                    "days": 0,
                    "enabled": false
                },
                "category": "AllMetrics"
            }
        ]
    }
}
Metrics in diagnostic settings tend to be simpler. Most services, including Key Vault, expose a single “AllMetrics” category. However, some services might include additional metric categories tailored to their unique functionality. These additional categories can be critical when monitoring specialized behavior or performance metrics.
By exporting the ARM template JSON, you gain a complete view of the diagnostic settings for a resource, including what log categories and category groups are available, whether they are enabled, and their retention policies. This method not only helps you discover the available telemetry options for a service but also serves as a starting point for automating the deployment of diagnostic settings across your environment. The JSON structure lays out all the necessary details, from the category and group names to their enabled states and associated policies, making it easier to replicate or customize settings programmatically.
The ability to explore log categories and category groups through the Azure portal’s ARM template export is an invaluable tool for fine-tuning your Azure Monitor configurations and plug the right values into whatever Infrastructure-as-Code tool you might be using, Bicep or Terraform alike.
It bridges the gap between service-specific telemetry and operational requirements, ensuring that you collect the right data to meet your monitoring and compliance needs. By leveraging this feature, you can demystify the diagnostic settings of even the most complex Azure services and build a foundation for robust and scalable observability. It’s definitely a go-to for me!